Soda tax debates: A case study of Berkeley vs. Big Soda’s social media campaign
Thursday, January 28, 2016
Social media is changing how communities and groups communicate and rally to build capacity in election campaigns.1-4 Social platforms like Facebook and Twitter can support citizens' civic action and have the potential to drive news and political agendas.3, 5 In 2014, voters in Berkeley, California, were asked to decide whether to place an excise tax on sugary drinks sold within city borders. Berkeley vs. Big Soda, the city's pro-tax campaign, turned to social media to communicate with residents and other audiences. The city made history in November 2014 when it passed the nation's first tax on sugary drinks, despite the beverage industry spending more than $2.4 million on an anti-tax campaign.6 Advocates and stakeholders in other communities can use this case study to strategize about using social media in their campaigns to pass sugary drink taxes, fight chronic diseases and protect public health.
What we did
To better understand the pro-tax campaign's social media efforts, we conducted a content analysis of Berkeley vs. Big Soda's Twitter7 and Facebook8 posts and examined their social media analytics. Our analysis includes pre- and post-election posts from February 2014, when the campaign launched its social media strategy, through June 2015. We obtained Twitter data from Twitter and Twitonomy and Facebook data from the campaign's Facebook account. Our unit of analysis for Tweets and Facebook data was the post, including the text and, for Facebook posts, associated images. When the campaign posted a photo album, we coded only the first three images. We assessed native analytics from Twitter, Facebook and Twitonomy (Twitter only). We catalogued the gender, location and age (Facebook only) of channel audiences, impressions, and engagement (including likes, comments and shares for Facebook, and retweets, likes — formerly called "favorites" — and replies for Twitter).
For posts that @BerkvsBigSoda retweeted, we analyzed the content of the tweet, but data on engagement were not available, so we excluded these posts from our analyses of engagement. Although the campaign also used an Instagram account, we did not include it in our analysis because there were a small number of posts. To determine how the posts were framed, we first read a small number of Tweets and Facebook posts and, informed by our previous research on sugar-sweetened beverage framing in the news,9 developed a preliminary coding instrument. Before coding the full sample, we used an iterative process10 and statistical test (Krippendorf's alpha,11 ≥ .8) to ensure that coders' agreement was not occurring by chance. See Appendix 1 for a summary of the arguments contained in the posts and Appendix 2 for a glossary of social media and analytics terms.
What we found
We found 1,731 tweets and 250 Facebook posts from February 2014 through June 2015. We excluded 13 posts because they were not about sugary drinks, such as when the campaign promoted unrelated issues or posted links with no descriptions. Most of Berkeley vs. Big Soda's relevant posts occurred before the November 2014 election month (77% of Twitter posts; 87% of Facebook posts), with a large fraction during the two months leading up to the vote (42% of Twitter posts; 49% of Facebook posts).
Who was following the campaign on social media?
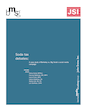
As of September 2015, the campaign had 594 followers on Twitter, and its Facebook page had 729 "likes" (followers). Across both channels, the majority of followers were women (59% and 69%, respectively) between the ages of 35 and 44 (25% of Facebook followers), and were located in California (see Figure 1 for geographic breakdown). According to Facebook data, while roughly half of followers (49%) were located in Berkeley, 28% were located in other California cities, many of them in the Bay Area (primarily San Francisco and Oakland). Over half of Twitter followers were located in California (53%); however, more specific location data were not available for Twitter (see Appendix 3, Table 2). Interestingly, 17% of Twitter followers were located outside of the U.S. Among Twitter followers, 80% were identified by Twitter as having an interest in "politics and current events" and 77% in "business and news" (similar data were not available for Facebook followers).
Figure 1: Location of Facebook and Twitter followers
Engagement and impressions
Between February 2014 and June 2015, the Berkeley vs. Big Soda campaign published 1,731 tweets and 250 Facebook posts. On Twitter, there were approximately 3.5 tweets per day, including both original posts and retweets of others' messages (39% of posts). Tweets received an average of five engagements per post (engagement includes retweets, favorites and replies) resulting in a 9% average engagement rate. Each tweet was retweeted an average of 1.67 times.
While there were fewer posts on Facebook overall, these posts produced more impressions (the number of times a post was delivered to users' news feeds or search results) and engagements per post compared to tweets. The average number of impressions for Facebook posts was 959, compared to 266 average impressions per tweet (see Appendix 3, Tables 3 and 4).
Engagement and impressions peaked in October and November
For Facebook posts, the average impressions per post spiked in October and November (1,511 and 2,377 impressions per post, respectively) and decreased thereafter. While lower, average impressions per tweet remained consistent over time. However, the total impressions over time were comparable across Twitter and Facebook, peaking in October with about 90,000 total impressions on each of the platforms in that month.
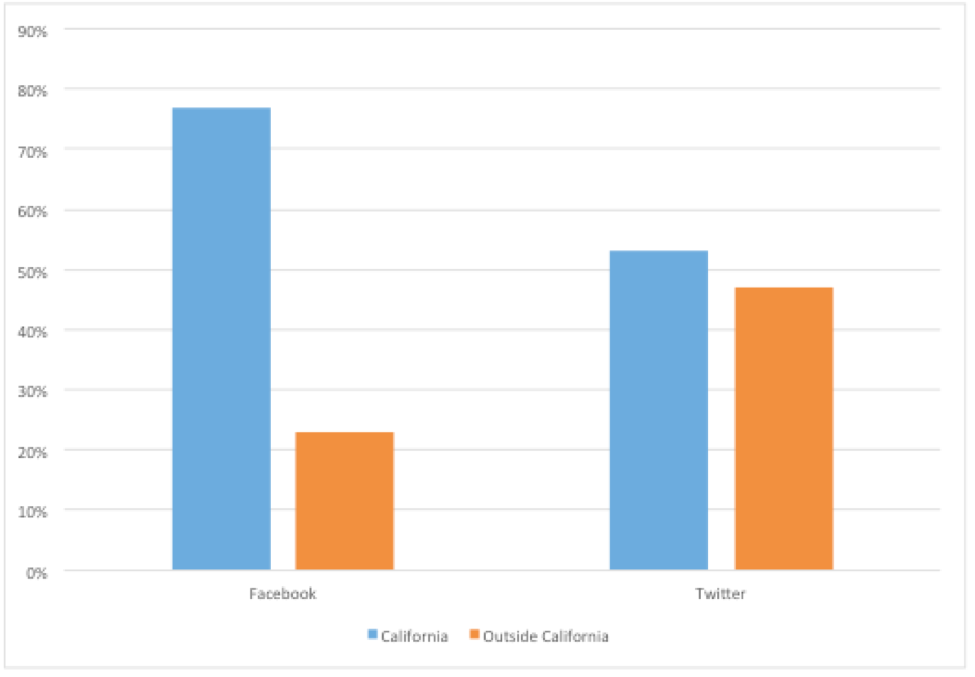
The most retweeted and most liked message pertained to the final election results. This tweet garnered a total of 10,825 impressions and 158 engagements (see Figure 2). On Facebook, a similar celebratory post reached 5,998 people and had 592 engagements (total number of likes, comments and shares on the original and shared posts).
Figure 2: Twitter post with high engagement
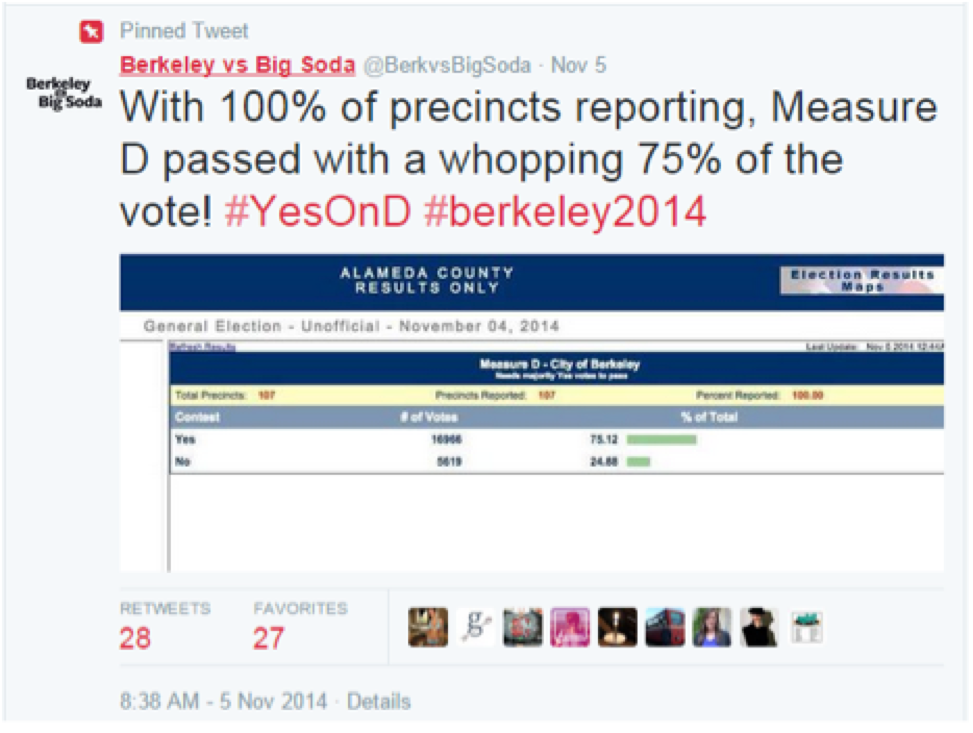
The post with the most lifetime impressions (27,972) was a Facebook message (posted Oct. 22, 2014) sharing a video12 developed by Robert Reich in support of the campaign: "In an entertaining new video, Robert Reich breaks down the facts on Berkeley's Measure D, Big Soda's tactics and outrageous spending, and tells the story of his encounter with a No on D pollster. http://ow.ly/DbDvH Vote #YesOnD!" (See Figure 3).
Figure 3: Screen shot of Robert Reich's video: "Like Coke or Pepsi? Wait Until You Hear What They Are Doing."
What were campaign posts about?
Berkeley vs. Big Soda used social media to frame the debate and announce events
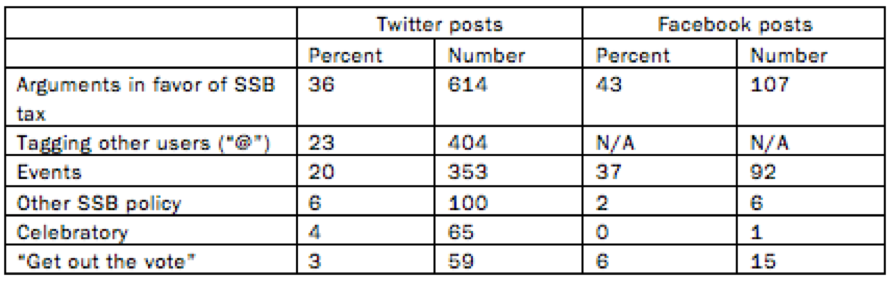
While arguments in favor of the tax were present in more than a third of posts (see Table 1), we found Berkeley vs. Big Soda also used the medium to tell the public about events, recruit volunteers for canvassing, encourage voters to head to the polls (often referred to as "Get Out The Vote"), discuss other sugary drink policies, and celebrate the election win.
Table 1: Topics of Berkeley vs. Big Soda posts on social media (February 2014-June 2015) Note: These are non-exclusive categories
In more than three quarters of posts, the campaign engaged in the common Twitter practice of using the "@" symbol to mention other users and converse with them. While traditional media typically rely on one-way message delivery from the sender to the recipient, Twitter allows users to have conversations.13 Interactions included retweeting others' messages (39% of campaign tweets), as well as replying to tweets (14% of tweets) and mentioning ("@") others. The campaign interacted with health advocacy organizations, including the Center for Science in the Public Interest, Soda Free Summer, Kick the Can (a project of the California Center for Public Health Advocacy), Berkeley Media Studies Group, and the Latino Coalition for a Healthy California. Berkeley vs. Big Soda also engaged with individuals such as Anna Lapp (Small Planet Institute/Food Mythbusters) and Jeff Ritterman, a former Richmond, California, city councilmember who fought for a soda tax there in 2012. It also engaged with local news outlets such as Berkeleyside and Beyond Chron.
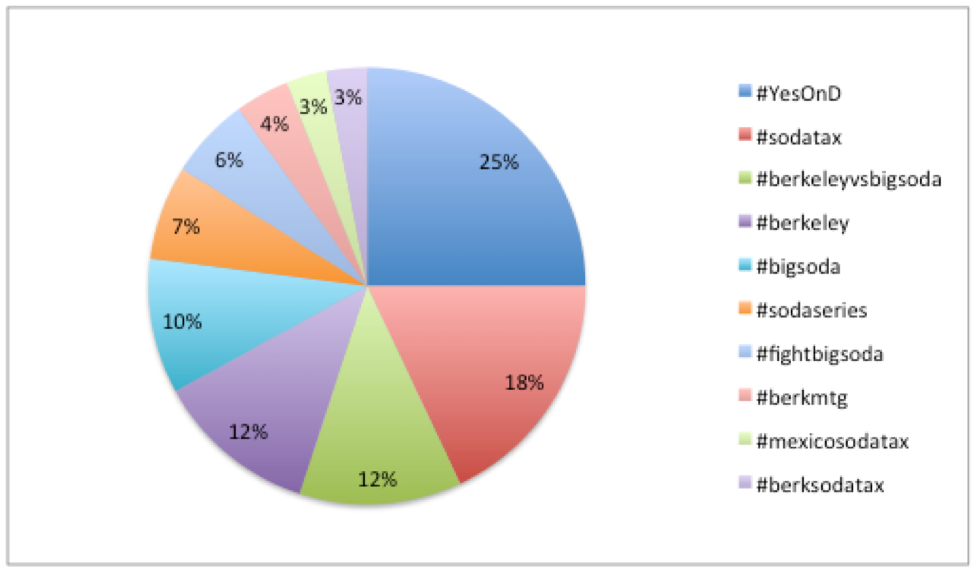
The campaign used hashtags — categories denoted by the "#" symbol — in 34% of tweets and 37% Facebook posts to connect their posts to broader conversations with other users. The most popular hashtags were #YesOnD (used after July 1, 2014, referring to the official ballot measure D), #sodatax, #berkeleyvsbigsoda and #berkeley (see Figure 4).
Figure 4: Top hashtags used by @BerkvsBigSoda
Celebratory comments did not comprise a large proportion of posts on Twitter and Facebook; however, they reached the greatest number of people per post. Celebratory tweets issued after the victory had quadruple the impressions and close to six times the engagement compared to non-celebratory posts, with an average of 27 engagements per celebratory tweet. The increase in engagement suggests social media users were interested in interacting with posts praising the passage of the tax proposal, such as when the pro-tax campaign wrote on Election Day, "With 100% of precincts reporting, Measure D passed with a whopping 75% of the vote! #YesOnD #berkeley2014."
What arguments did Berkeley vs. Big Soda use?
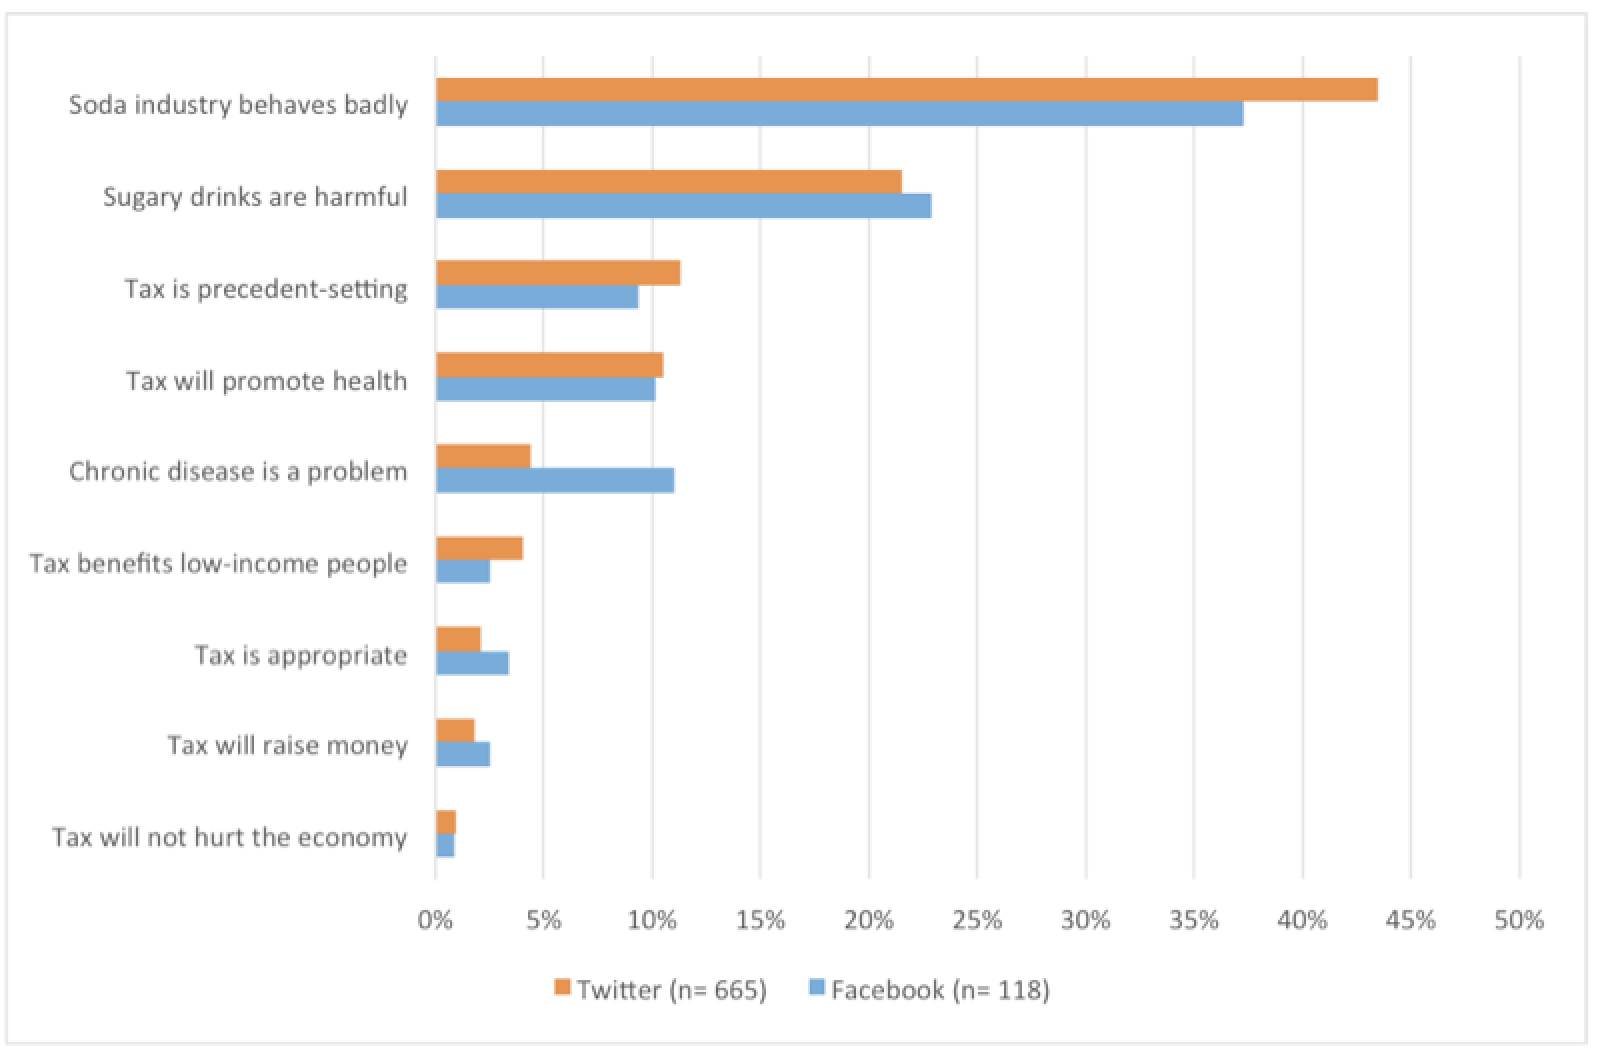
Figure 5: Arguments Berkeley vs. Big Soda used on social media (February 2014-June 2015)
Berkeley vs. Big Soda focused heavily on how the industry behaved badly in the campaign, and that appealed to audiences on both channels.
The most common theme in Berkeley vs. Big Soda's social media posts was how the sugar-sweetened beverage industry was behaving badly (accounting for 42% of Twitter arguments and 37% of Facebook arguments). Berkeley vs. Big Soda illuminated the bad behavior of both the soda industry's marketing tactics, and, to a greater extent, how the industry was acting inappropriately in the election. The "industry behaving badly" argument on Twitter increased in August 2014, as the pro-tax campaign began reporting the amount of funding the American Beverage Association was pouring into fighting the tax (see Figure 6). The American Bev