


Using social math to support your policy issue
by: Berkeley Media Studies Group
posted on Monday, March 30, 2015
Every day we are bombarded with news stories involving very large numbers. We hear about billions of dollars being spent by government or industry, or we might learn that hundreds of thousands of people are at risk for a particular disease. More often than not, these numbers do little to inform us because we don’t have a way of putting them into a meaningful context. After a certain point, the numbers stop making sense, which is why advocates must become skilled at social math.
“Social math” is the practice of translating statistics and other data so that they become interesting to the journalist, meaningful to the audience, and helpful in advancing public policy. Unlike infographics, which use visuals such as charts and graphics to present data, “social math is the practice of making large numbers comprehensible and compelling by placing them in a social context that provides meaning.” The best social math surprises people and provokes an emotional response. While advocates can use social math together with infographics or other visuals to make information more memorable and shareable, successful examples paint a picture — with or without the use of an image — that helps people see what you are saying.
Social math can be created by restating large numbers in terms of time or place, personalizing or localizing numbers, or making comparisons with familiar things. Another approach is using irony to make a point about misplaced societal values, such as how we spend more on products with little social value than we do on solving core health concerns.
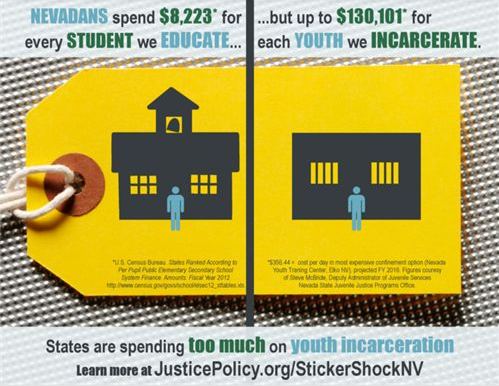 One powerful example of social math being leveraged effectively comes from the Justice Policy Institute and ACLU of Nevada, whose recent joint social media campaign, launched this month, draws attention to the state’s high cost of youth incarceration. To highlight the need for juvenile justice reform and push policymakers to rethink corrections spending, the groups created a series of infographics showing how funds dedicated to critical social investments such as education — $8,223 per student per year — are dwarfed by spending to jail youth — up to $130,101 per youth per year. Using the hashtag #StickerShock, the campaign features images of pricetags with side-by-side cost comparisons and asks, “Schoolhouse or jailhouse? How would you invest in Nevada’s youth?”
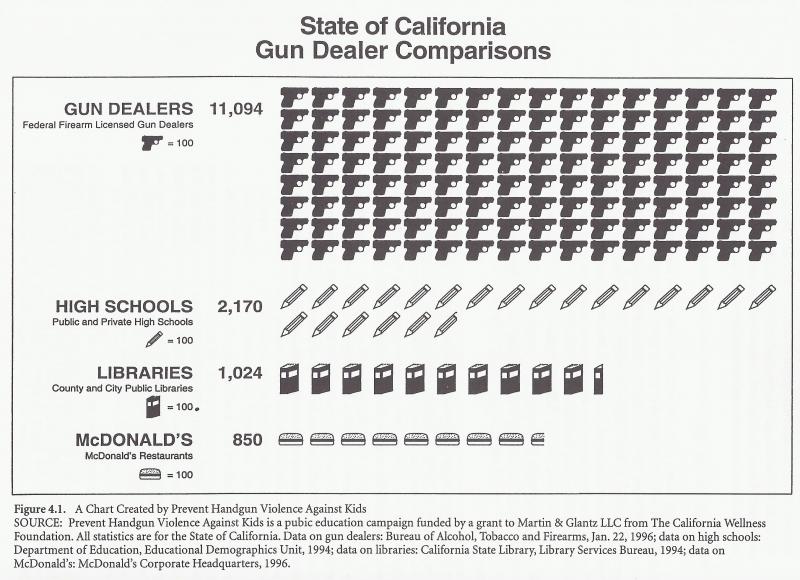
Another memorable example comes from advocates concerned about gun violence, who, in 1996, found that there were more than 11,000 gun dealers in the state of California. In a creative use of social math that remains relevant today, they put the issue into context by creating a chart showing the number of gun dealers in comparison to the state’s McDonald’s (850), high schools (2,170), and libraries (1,024). This brought the issue of gun availability to life: McDonald’s restaurants seemed to be everywhere, but there were more than 10 times as many firearms dealers. At the same time, the comparison brought into the frame images related to young people — schools and libraries — so the audience would be reminded of the things society could provide more of for children and youth.
Getting started with social math
Before making your case for an issue — whether through an interview with a journalist, testimony in front of decision-makers, or a carefully crafted op-ed or blog — collect all the numbers you may need; then consider which ones will best support your policy goals and help you to field tough questions. Ask yourself,
- How will you describe or quantify the problem?
- What comparisons to other issues, populations, geographic areas, changes over time, or policy solutions might help you?
- What does each number or comparison show about the way the world works now or about what should be different?
- Will you need fiscal estimates to clarify the cost of the problem or policy solution?
After you’ve decided which numbers will likely be most effective, make them count by presenting them creatively, perhaps by incorporating them into an infographic. Knowing what advocacy point you are trying to make with them will help you decide what type of social math to create. It will also help you resist the temptation to drown reporters and readers in statistics or graphs. Remember, you can’t be comprehensive and strategic at the same time.
Tips for calculating social math
1. Break the number down by time.
If you know the amount over the course of one year, what does that look like per day, per hour, or per minute?
“The food and beverage industry spends $2 billion a year just targeting kids — that’s more than $5 million every day just to reach children and youth.”
2. Break the number down by place.
Comparing a statistic with a well-known place can give people a sense of the statistic’s magnitude.
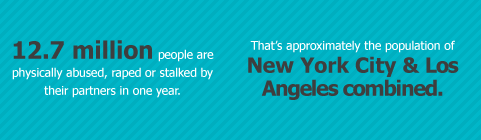
“12.7 million people are physically abused, raped or stalked by their partners in one year. That’s approximately the population of New York City & Los Angeles combined.”
3. Personalize or localize your numbers.
Doing so can make an issue more meaningful to community members and policymakers and can help highlight social or health inequities in a specific region. For example, using population figures, you can calculate your state or county’s share of the annual costs of nationwide health issues. And breaking numbers down by legislative district can help hold the legislator whose district is affected accountable.
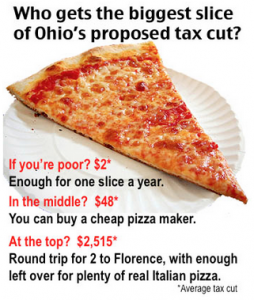 In one scenario, an Ohio-based nonprofit policy research organization used a pizza analogy to demonstrate the inequitable impact that Gov. John Kasich’s proposed income-tax cuts would have on the state’s residents, based on yearly earnings: “An across-the-board cut in rates favored by Gov. Kasich may allow low-income Ohioans to buy a slice of pizza a year, on average. Those in the middle could purchase a cheap pizza maker, while the state’s most affluent taxpayers could use their cut to go on a round-trip for two to Italy, with money left over to pay the hotel bill and buy some real Italian pizza.”
Note how the same issue loses meaning when presented in a standard chart format, absent of social context. A similar approach using analogies could be used to reveal inequities based on race, gender, sexuality, age, or ability.
This standard chart without social context carries less meaning. 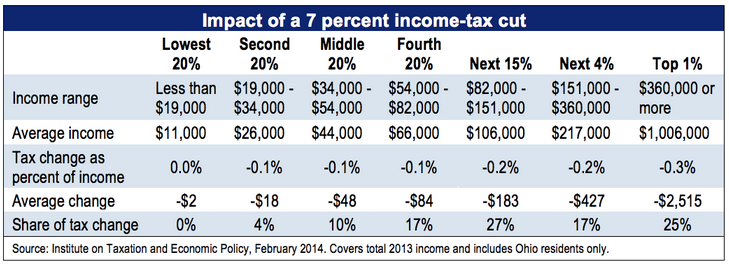
4. Provide comparisons to familiar things.
Compare and contrast your numbers with something easily identifiable to the audience.
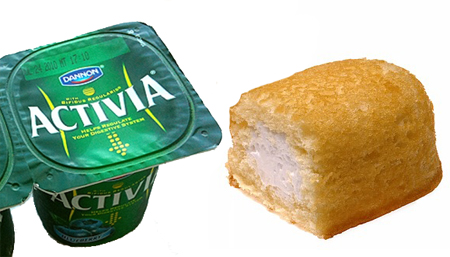
For example, advocates have used comparisons with junk foods like Chips Ahoy cookies and Twinkies to show how much sugar is in many foods commonly thought of as healthy: “Activia walks a fine line with 19 grams of sugar per 4.4-ounce container of the blueberry flavor. That’s as much as a Twinkie, in a smaller-than-average serving size.”
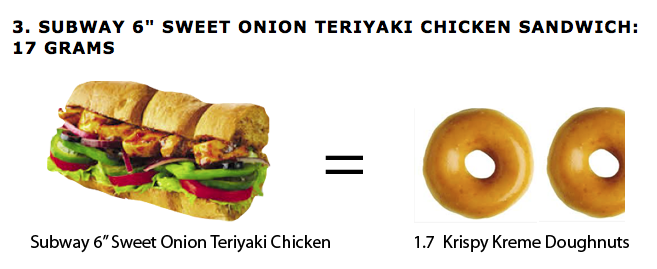
In the same vein, a Mother Jones story tells us about “9 surprising foods with more sugar than a Krispy Kreme doughtnut,” including this sandwich from Subway:
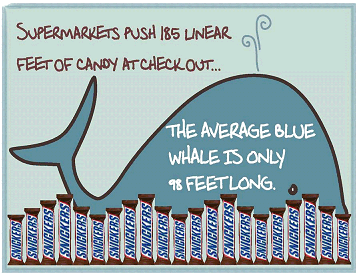
And, here, a surprising juxtaposition from the Center for Science in the Public Interest puts an often overlooked aspect of our food environment into perspective: “Supermarkets push 185 linear feet of candy at checkout the average blue whale is only 98 feet long.”
5. Provide ironic comparisons.
Doing so can draw attention to an unmet need, suggest more appropriate use of resources, point out skewed priorities, or make a case for policy change. By using comparisons that are unexpected, advocates not only make information understandable, they make it memorable. For example, this headline from the Progressive Change Campaign Committee is both jarring and effective in pointing out that the country’s small but vocal opposition to gun background checks is a fringe position: “More Americans believe Elvis is alive than oppose universal background checks for gun buyers.”
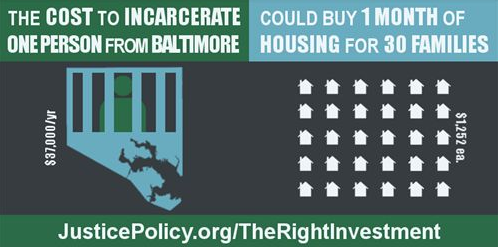
And another bold campaign from the Justice Policy Institute uses shocking numbers to question the city of Baltimore’s investment priorities: “The cost to incarcerate one person from Baltimore could buy 1 month of housing for 30 families.”
What types of social math have you seen or used to make the case for a public health or social justice issue? Let us know at info@bmsg.org or @BMSG.